Real-time data monitoring
Real-time data monitoring component provides a system for receiving events produced by sensors. This S2CP component can collect information generated in a city, farm or other food-related organization, so that information can be later represented for real-time visualization or monetization.
Functional architecture

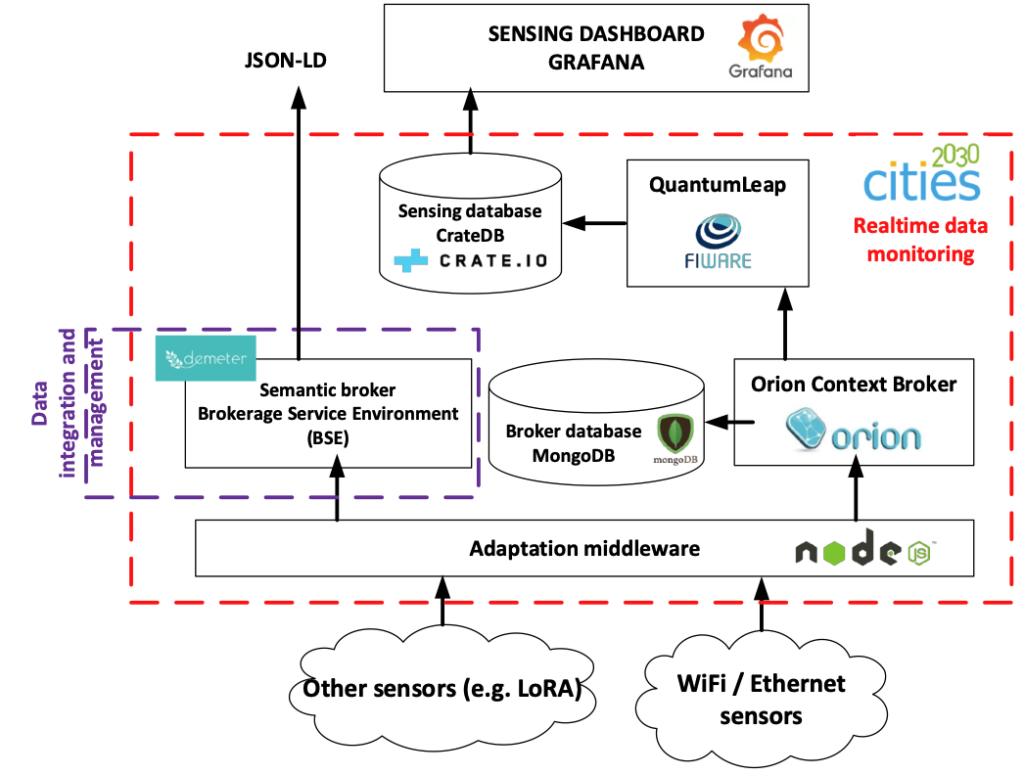
The functional architecture demonstrates that different types of sensors supply data to real-time data monitoring, including WiFi/Ethernet sensors and sensors that communicate using well-established technologies such as LoRA or SigFox. A connector-based adaptation middleware acts as a communication proxy and transmits information to two types of brokers:
- The Semantic Broker (BSE): This broker publishes interfaces for data consumption using a semantic model compatible with the data integration and management tool. It is based on semantic models from previous projects such as DEMETER.
- The Orion Context Broker: This is a FIWARE component optimized for sensor data communication and supports the NGSIv2 protocol.
To ensure the persistence of information received from the sensor infrastructure, the QuantumLeap module is used. This FIWARE component stores all sensor updates in a CrateDB sensing database.
This database serves as a source of information for representing the received data on a dashboard, enabling subsequent analysis, filtering, and use as a decision support system.
- The semantic broker BSE publishes the interfaces for data consumption through a semantic model compatible with the data integration and management tool, and based on semantic models from previous projects such as DEMETER.
- The Orion Context Broker is a FI-WARE component optimized for sensor data communication, which supports the NGSIv2 protocol.
To provide persistence to the information received by the sensor infrastructure, the QuantumLeap module is used, another FI-WARE component that saves all sensor updates in a CrateDB sensing database.
Finally, this database can be used as a source of information for the representation of the information received in a dashboard, for subsequent analysis, filtering and as a decision support system.
Conducting the experiment
The hypothesis to validate states that using the S2CP platform reduces the number of thermal discomfort episodes experienced by food processing personnel by 10% and generates real-time alerts within less than 30 seconds from error detection.
Variables such as temperature, humidity, power consumption, and air quality are monitored through sensor nodes. A framework of performance and economic indicators is generated, and their changes and projected evolution after adopting the Industry 4.0 paradigm are analyzed.
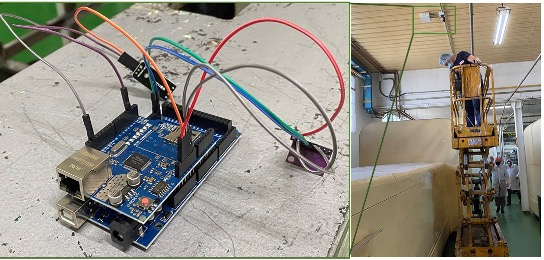
To achieve this, the real-time data monitoring component developed by UPM-P20 is used. This component receives events produced by sensors and represents the measures for real-time visualization or monetization. As stated in Section 8.2, this component requires input data from an Internet of Things (IoT) hardware platform, which is defined and deployed at the pilot site. The output of this component includes a database containing all captured real-time information expressed in a semantic and interoperable format (according to data models defined in T6.2) and a visualization dashboard that facilitates data visualization, filtering, and simple analysis.
The following figure illustrates the deployed platform:
Variables such as temperature, humidity, power consumption and air quality were monitored through sensor nodes. A framework of performance and economic indicators is generated, and we analyze their changes and envisioned evolution after the Industry 4.0 paradigm adoption.
To achieve that, the real-time data monitoring component developed by UPM-P20 was used, as it can receive events produced by sensors and represent the mesaures for real-time visualization or monetization. As stated in Section 8.2 this component requires some data input coming from an Internet of Things (IoT) hardware platform, which must be defined and deployed in the pilot site. The output of this component will be a database containing all captured real-time information, expressed in a semantic and interoperable format (according to data models defined in T6.2), and also a visualization dashboard to facilitate data visualization, filtering and some simple analysis.
The following figure shows the deployed platform:

All software components are deployed in a private cloud at the Universidad Politécnica de Madrid. The underlying server uses a Linux architecture (Ubuntu 20.04 LTS) with the following hardware characteristics: Dell R540 Rack 2U, 96 GB RAM, two Intel Xeon Silver 4114 processors running at 2.2 GHz, and a 2TB SATA hard drive at 7,200 rpm.
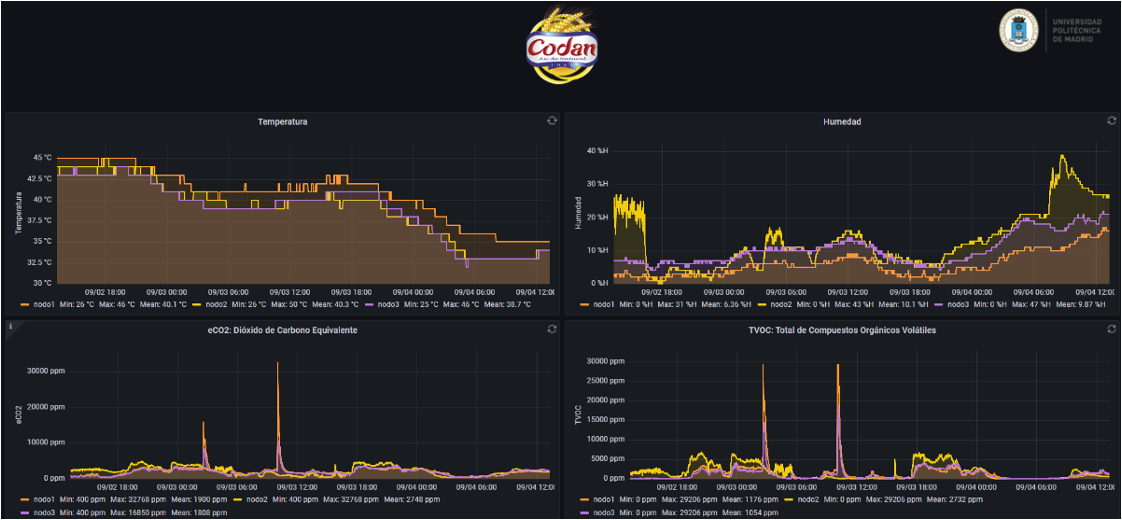
To analyze the evolution of all indicators in the KPI framework, the methodology is designed and implemented. Data is collected over six months, and all indicators are evaluated.
The following figure shows the collected information:

